The web speaks of the brand by itself; it is a reflection of what the brand is and what the user perceives of it. Throughout the day the web page is filled with hundreds or thousands of visits, traffic that is quite difficult to control and to bring to our own terrain. For this, it is necessary to have tools such as heat maps, a resource that allows us to know more about the user, to know what they like and what they spend more time on, without forgetting that the user experience within the online environment is primordial.
What is a web heat map?
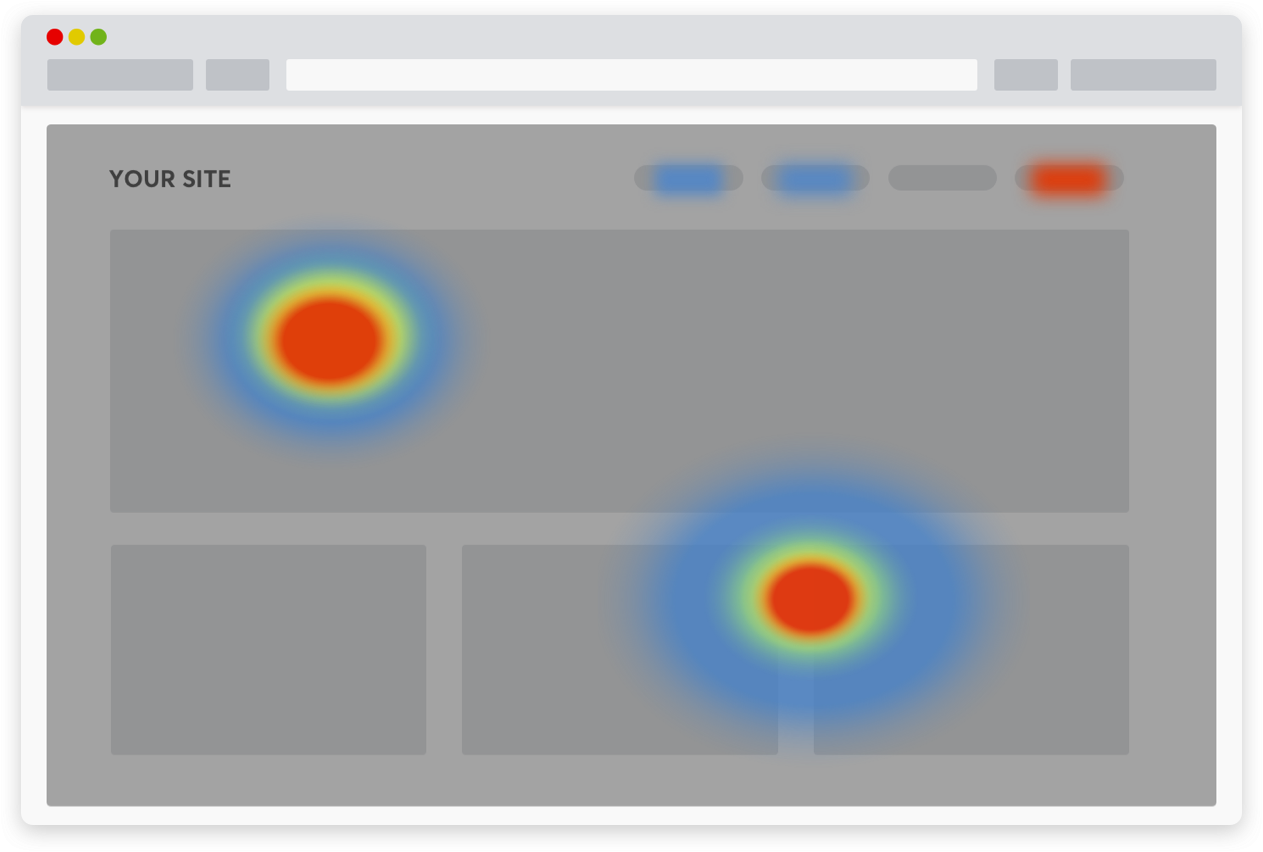
It is a graphic representation in which different colors are used to indicate the different parts of the web page in which users perform the most interactions, the sites on which the navigator clicks, the parts that are read and those that they pass over… It is a way of controlling the user’s activity with the aim of offering a better experience in the digital environment, since in this way statistical data is obtained that allows the website to be perfected, making it more easily navigable.
Different types of heat maps according to the need
There are different types of heat maps or heatmaps according to the specific needs that are sought to be obtained. Each map is different and the choice between one or the other is made based on the information sought to be obtained. Among the most used are:
- Click map: it becomes known in which parts of the web users click the most, which allows paying more attention to the parts that generate the most traffic in order to avoid possible conversion leaks. This type of map is quite reliable since it collects voluntary user actions.
- Mouse movement map: detects the movement of the user’s mouse within the web, although this type of map is more difficult to analyze and has certain limitations, to obtain reliable data it is advisable to counteract with other sources, such as analytics tools web such as Google Analytics or with other heat maps.
- Scroll map or vertical displacement: it allows you to know how far the user reads, in which parts he stops and the ones he passes over. This offers you the possibility of adapting the text according to the activity of the visitor, identifying areas of little interest and considering a change in the structure of the web.
Main objectives of heat maps
These are some objectives and benefits of using heat maps for your website:
- Detect failures on our website: it can guide us when framing the structure of the page, how to arrange the graphics, images, if the image-text combination works correctly…
- Measure the ideal sites to include advertising: It guides us in determining which sites we should include ads on due to the traffic they generate. However, we must be careful not to place advertising in the most attention-grabbing places, as this would reduce the prominence of the web content itself.
- Know the most visible spaces on our website: they offer us all the information we need to know what content and what elements we should include in which places they should appear to have more visibility… In this way we come to understand focusing the user’s interaction and know where to focus your attention.
- Measure the distance that users travel: specifically, the movement maps allow us to observe to what extent users view the page, being able to determine the optimal length of the page and the degree of interest on the website. These maps can provide information on the extent to which users browse the content and leave the site.
- Optimize the conversion rate: Heat maps help to understand how users interact with the web so that they can solve answers to critical business questions. A solution to increase the conversion rate could be to redesign the page so that the content is more organized and structured, allowing you to continue browsing it. Likewise, you could choose to move the CTAs above the fold and facilitate interaction with the interface.
Tools to make a heat map
These maps use a standardized color scheme. The areas that have fewer visits (the so-called cold ones) are marked with the color green or blue, while the hottest ones can be represented with the color red, orange or yellow.
The most important thing about these maps is to apply them for a certain time, since in this way relevant data can be obtained to create statistics that add value and improve the user experience on the web. Among the tools used to generate them are:
- Crazy Egg: one of the most widely used tools for creating heat maps, it also allows for A/B testing and provides information on search terms, browsers, and operating systems used.
- Hotjar – Freemium tool that works with all major website building and ecommerce platforms. Being responsive, heat maps can be created regardless of the device used by visitors.
- Mouseflow – Tracks user behavior and sends the data back to the platform. When installing it, you need to add a code snippet to the web page.
- Clicktale: another of the most popular tools, it is responsible for providing different analyzes of the traffic of your web page in real time. It is focused on web pages with a large volume of traffic.
- Microsoft Clarity: It is a free tool launched by Microsoft in 2021. It is equipped with a wide range of features such as its integration with Google Analytics, real-time data processing through a control panel.
Heat maps are very useful to detect those points of improvement on your website, they provide relevant information, especially for ecommerce, they play a fundamental role in the continuous improvement of a website in terms of increasing conversion rates, usability and a better user experience
However, heat maps must be analyzed in conjunction with other analytical data. In this way, it will be possible to have a global vision of the interaction on the page, and it will be possible to find out if the content that is being produced really attracts users or should be modified.
Would you like to apply heatmaps and make user enhancements? Our Digital Analytics and Website Development teams will be happy to help you. Do not hesitate to contact us.